现在已经能记录账单并显示账单了,接下来可以自己录入一些数据,然后生成图表。
图表我们用echarts,当然用其他的比如highchart也是类似的做法。在前面的文章中已经在head中添加了echarts,我们目前需要做的就是在html中为图表定义一个区域,并在script中定义图表的属性,通过ajax调用后端并将数据更新到图表中。我计划的是添加柱状图用来展示当月每天的收支和当年每月的收支,添加饼图来展示当月的和当年的收支类型比例,一共四个图。
以当月每日收支柱状图为例,先在html中定义区域:
<div class="row" align="center">
    <div class="col-lg-6 mb-6">
        <div id="month-bar-chart" style="width:100%; height: 400px; padding: 10px 0px;"></div>
    </div>
    ...
</div>
需要注意的是我们应该定义个宽高,否则图表显示不出来,这里是宽度为父节点的宽度,高度是定的400px。如果你遇到不能正常获得父节点宽度的情况,可以看看我之前记录的另一篇:Echarts在bootstrap切换tab时无法正常显示的解决办法
先占了位,但也应该定义一下图表的属性,比如这个是柱状、x轴和y轴、颜色、鼠标移上去的数据展示等等。于是添加一块script,记得加在<script></script>之间:
var monthBarChart = echarts.init(document.getElementById('month-bar-chart'));
var monthBarOption = {
    title: {
        text: '当月每日收支记录',
        left: 'center'
    },
    grid: {
        right: '10px'
    },
    legend: {
        data: ['支出', '收入'],
        x: 'right',
        y: 'top'
    },
    tooltip: {},
    xAxis: {
        data: [],
        axisLabel: {
            //interval: 3,
            rotate: 30
        },

        splitLine: {
            show: true
        }
    },
    yAxis: {
    },
    series: [{
        name: '支出',
        type: 'bar',
        color: '#FF4500',
        data: [],
        animationDelay: function (idx) {
            return idx * 10;
        }
    }, {
        name: '收入',
        type: 'bar',
        color: '#3CB371',
        data: [],
        animationDelay: function (idx) {
            return idx * 10 + 100;
        }
    }],
    animationEasing: 'elasticOut',
    animationDelayUpdate: function (idx) {
        return idx * 5;
    }
};
monthBarChart.setOption(monthBarOption);
这里是设置了样式,但并没有定义series里的data,因为我们需要从后端获取数据并更新到series。再添加一段ajax代码:
$.ajax({
    type: "GET",
    url: "{% url 'retrieve_current_month_income_expense' %}",
    cache: false,
    dataType: "json",
    success: function (result) {
        monthBarOption.xAxis.data = result["days"];
        monthBarOption.series[0].data = result["days_expense"];
        monthBarOption.series[1].data = result["days_income"];
        monthBarChart.setOption(monthBarOption);
    }
});
打开对应的tab时便会请求后端数据,并更新图表的数据,令其展示出来。
然后我们接着在views里添加一个方法:
def retrieve_current_month_income_expense(request):
    if request.user.is_authenticated:
        post_year = request.POST.get('year')
        post_month = request.POST.get('month')
        if post_year and post_month:
            year = int(post_year)
            month = int(post_month)
        else:
            today = datetime.date.today()
            year = today.year
            month = today.month
        month_has_days = calendar.monthrange(year, month)[1]
        days = [datetime.date(year, month, day).strftime("%Y-%m-%d") for day in range(1, month_has_days+1)]
        days_income = []
        days_expense = []
        category_names = []
        month_category_income = {}
        month_category_expense = {}
        month_total_income = 0
        month_total_expense = 0
        month_history_records = HistoryRecord.objects.filter(time_of_occurrence__year=year, time_of_occurrence__month=month).order_by("time_of_occurrence")
        for day in days:
            day_history_records = month_history_records.filter(time_of_occurrence__day=int(day.split("-")[-1]))
            day_income = 0
            day_expense = 0
            for hr in day_history_records:
                hr_category = hr.category
                if hr_category.category_type.lower() == "expense":
                    day_expense += hr.amount
                    month_total_expense += hr.amount
                    if hr_category.name not in category_names:
                        category_names.append(hr_category.name)
                        month_category_expense[hr_category.name] = {"value": hr.amount, "name": hr_category.name}
                    else:
                        month_category_expense[hr_category.name]["value"] += hr.amount
                elif hr_category.category_type.lower() == "income":
                    day_income += hr.amount
                    month_total_income += hr.amount
                    if hr_category.name not in category_names:
                        category_names.append(hr_category.name)
                        month_category_income[hr_category.name] = {"value": hr.amount, "name": hr_category.name}
                    else:
                        month_category_income[hr_category.name]["value"] += hr.amount
            days_income.append(day_income)
            days_expense.append(day_expense)
        return JsonResponse({"days": days,
                             "days_income": days_income,
                             "days_expense": days_expense,
                             "month_total_income": month_total_income,
                             "month_total_expense": month_total_expense,
                             "month_category_names": category_names,
                             "month_category_income": list(month_category_income.values()),
                             "month_category_expense": list(month_category_expense.values())})
    else:
        return JsonResponse({"error": "unauthenticated"})
这一段会有点长,因为也同时生成了当月收支饼图的数据。当月收支饼图也和柱状图一样的方式,只是属性会不一样,可以在echarts官网中获得对应类型的script: echarts examples
对于各类型的属性含义,可以查询echarts官方文档:echarts option document
再更新一下urls.py:
urlpatterns = [
    ...
    path('retrieve_current_month_income_expense/', views.retrieve_current_month_income_expense, name='retrieve_current_month_income_expense'),
    ...
]
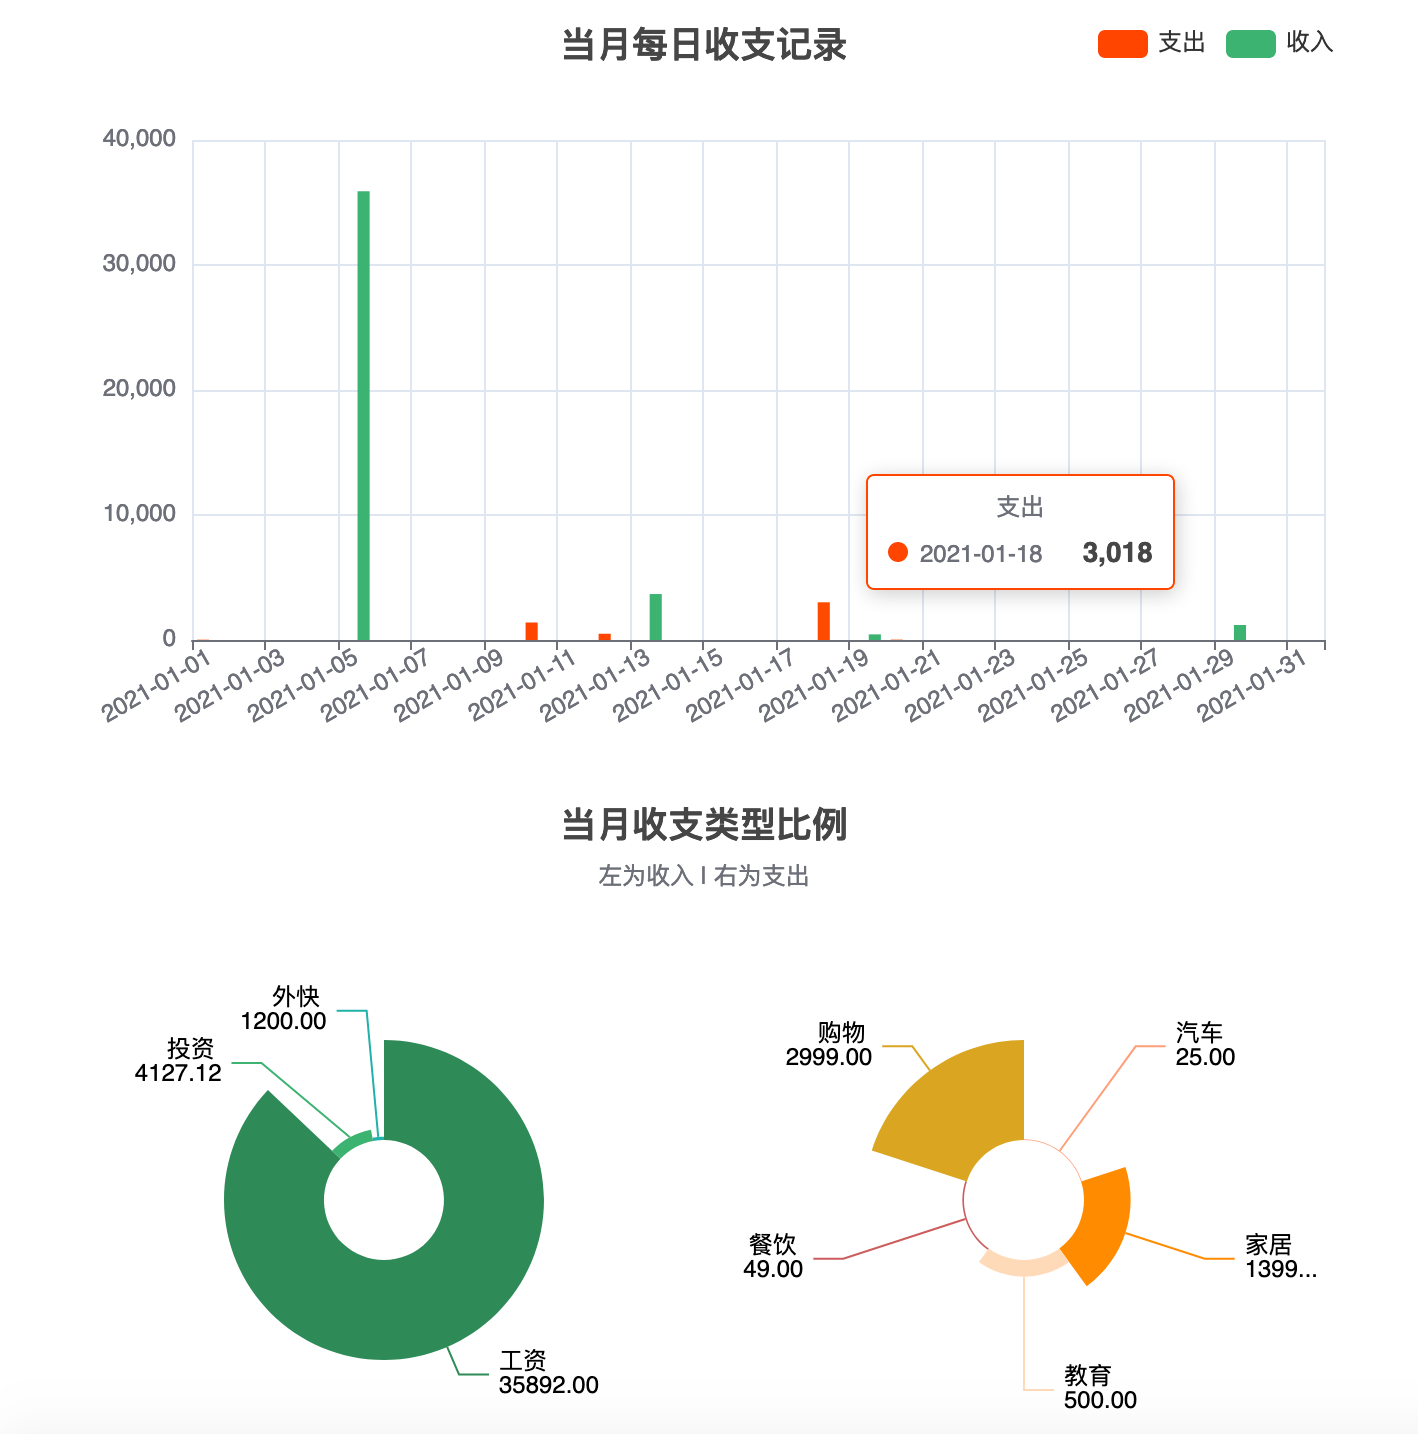
重新运行python manage.py runserver,并能看到如下的图标了:
因为bootstrap是支持响应式布局的,于是在手机端也能看到类似的效果:

文章评论 (2)
@南 我这里是在html里的<script></script>里加的,也可以放在js文件里再引用该文件
你好,请问直接在js文件中可以直接用模板语言?因为不想在html中写画echarts的图表