python是简单好用,不过性能也确实是个公认问题。虽说对于复杂点的程序可以用c来代替核心算法,再用python将其集成。不过在日常使用中,python本身仍然是被作为主要使用,有时需要检查python程序的性能表现是否合理,在哪里有过多的调用,以便优化。
我们可以用到cProfile和profile。两者差不多,都是内置模块,区别在于cProfile是用c语言实现,适合分析长时间运行的程序;而profile是python模块,难免会增加程序的开销。这里使用cProfile。
可以直接将检查单行代码的表现,比如:
import cProfile

cProfile.run('[x for x in range(100000) if x % 2 == 0]')
此时能看到输出:
4 function calls in 0.009 seconds

   Ordered by: standard name

   ncalls  tottime  percall  cumtime  percall filename:lineno(function)
        1    0.008    0.008    0.008    0.008 <string>:1(<listcomp>)
        1    0.000    0.000    0.009    0.009 <string>:1(<module>)
        1    0.000    0.000    0.009    0.009 {built-in method builtins.exec}
        1    0.000    0.000    0.000    0.000 {method 'disable' of '_lsprof.Profiler' objects}
其中ncalls是调用次数;tottime是在指定函数中消耗的总时间(不包括调用子函数的时间);第一个percall是 tottime 除以 ncalls 的商;cumtime是指定的函数及其所有子函数(从调用到退出)消耗的累积时间。这个数字对于递归函数来说是准确的;第二个percall是 cumtime 除以原始调用(次数)的商(即:函数运行一次的平均时间);filename:lineno(function)是提供相应数据的每个函数。
另外可以检查自定义函数,比如:
import cProfile


def add_num(a, b):
    return a+b


def sum_odd(number_range):
    total = 0
    for n in range(number_range):
        if n % 2 != 0:
            total = add_num(total, n)
    return total


if __name__ == "__main__":
    cProfile.run('sum_odd(10000)')
输出为:
5004 function calls in 0.002 seconds

   Ordered by: standard name

   ncalls  tottime  percall  cumtime  percall filename:lineno(function)
        1    0.000    0.000    0.002    0.002 <string>:1(<module>)
     5000    0.000    0.000    0.000    0.000 try_cprofile.py:5(add_num)
        1    0.001    0.001    0.002    0.002 try_cprofile.py:9(sum_odd)
        1    0.000    0.000    0.002    0.002 {built-in method builtins.exec}
        1    0.000    0.000    0.000    0.000 {method 'disable' of '_lsprof.Profiler' objects}
我们能看到调用sum_odd为1次,调用add_num为5000次。
另外还可以指定检查文件,比如运行命令:
python -m cProfile try_cprofile.py
关于可视化,一是可以生成火焰图。
pip install flameprof
python -m cProfile -o output.prof try_cprofile.py
flameprof output.prof > output.svg
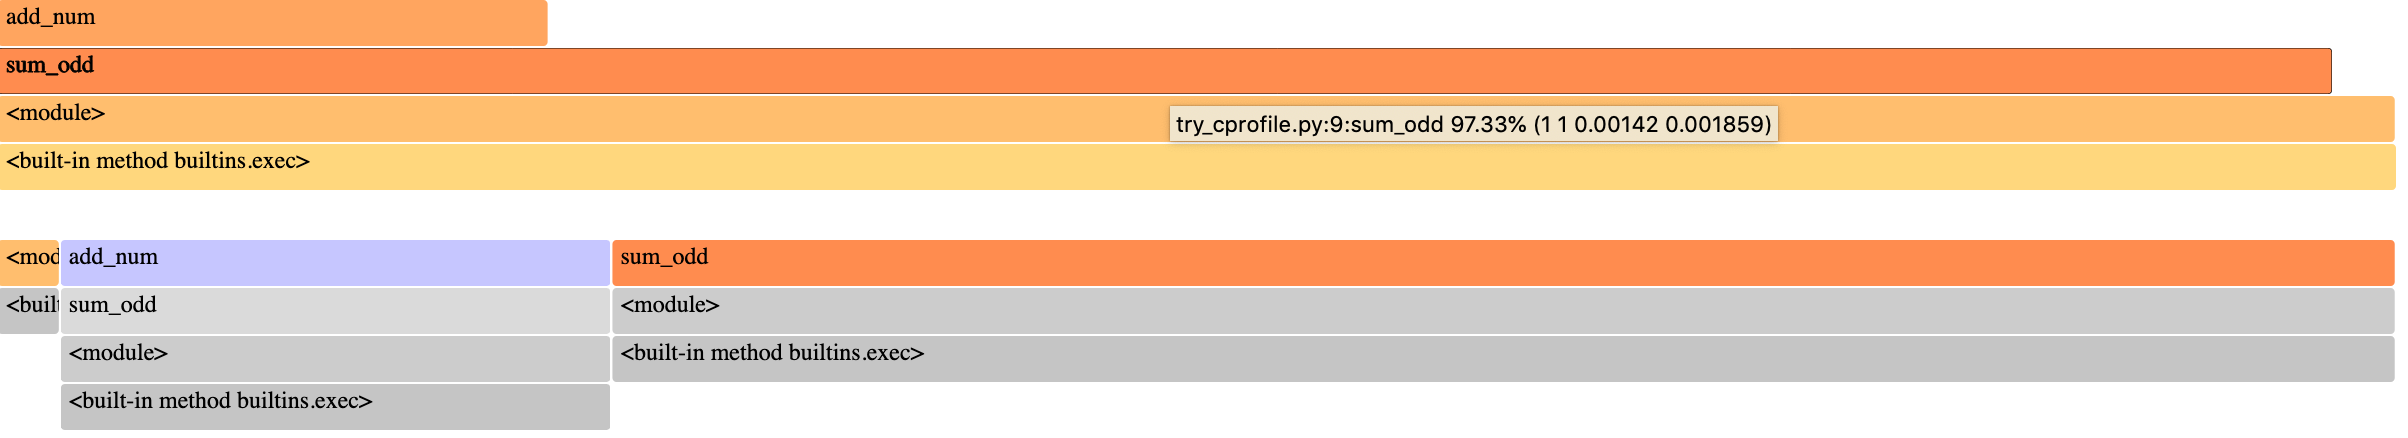
此时打开svg文件便可看到火焰图,图分成上下两部分,上半截的图是按照函数调用和执行时间排列,排在最上的往往是被调用的子函数。下半截的图按照函数执行时间比例从大到小排列。鼠标mouseover上去能看到时间信息。
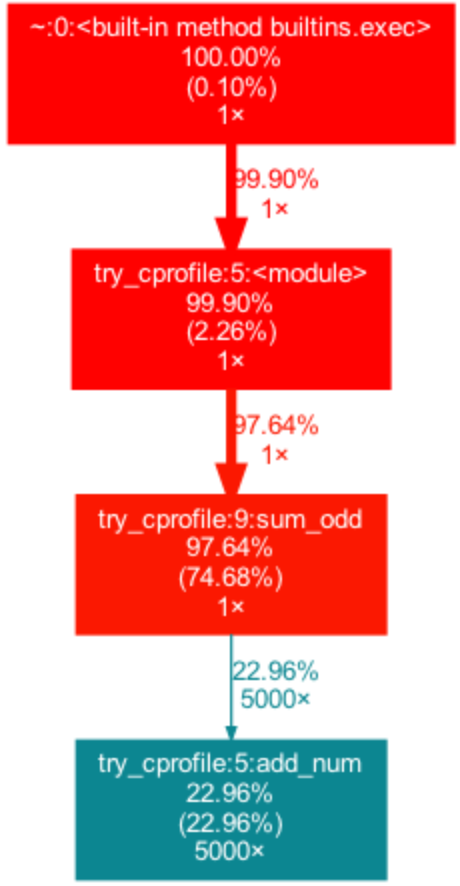
另一种是生成类似流程图一样的,我个人比较喜欢这种。
pip install gprof2dot
brew install graphviz
python -m cProfile -o output.pstats try_cprofile.py
python -m gprof2dot -f pstats output.pstats | dot -T png -o output.png
文章评论 (0)